Open data is essential to understanding and improving where we live, work and play. In the spirit of open data and in respect to the public information sources I’ve drawn upon over the years, I’ve made it easier to do your own analysis on local metroscapes.
This open data portal is where you can download Metroscapes project data. Links to the project pages, data download and revision dates are all provided below.
This is a work in progress, but you should be able to access data in the following ways:
► Tabular – Google Sheets webpage or comma-separated values (CSV) sheet
► Spatial – Zipped GIS Shapefile folder or Keyhole Markup Language (KML) file(s)
If you’re new to downloading and viewing mapping data, I suggest using the KML files in Google Earth or Google My Maps. If you’re just breaking into GIS and need a free easy-to-use program, I highly recommend QGIS.
Licensing and Disclaimers
By downloading or otherwise using data from Metroscapes, you agree to and acknowledge the following:
- Unless otherwise noted, information on this data portal is published under a Creative Commons Attribution-NonCommercial-ShareAlike 4.0 International (CC BY-NC-SA 4.0).
- All rights are reserved for the Metroscapes logo, the “Metroscapes” name and tagline “Exploring the intersection of natural and built environments”, or any standalone works with the Metroscapes logo applied.
- Some of the geographic information on this website was created with supporting information made available under the following open data licenses. Please check the respective licences for terms and conditions:
- Conservation Authority
- Much of the data is interpretive in nature and shall not be construed as being derived from or endorsed by government or private parties. You are not granted any right to use this data in a way that suggests any official status or that Metroscapes endorses you or your use of the data. This data is provided ‘as is’ and excludes all representations, warranties, obligations and liabilities. Metroscapes is not liable for any errors or omissions in the information and will not, under any circumstances, be liable for any direct, indirect, special, incidental, consequential, or other loss, injury or damage caused by its use, or otherwise arising in connection with this data even if specifically advised of the possibility of such loss, injury or damage.
- Data from Toronto, Guelph, Mississauga, York Region and Niagara Falls has been refined using open property parcel data. Those municipalities maintain their own parcel data. Other municipalities rely on the Ontario Parcel dataset, which is controlled through an agreement between the Ontario government, the Municipal Property Assessment Corporation, and Teranet Enterprises. This parcel information is not available to the general public without a fee. As such, projects outside of Toronto / Guelph are unrefined and based on general estimates and fences / walls, and should be discounted accordingly.
- GIS data is created and displayed in static images in the NAD83 / UTM zone 17N coordinate reference system (ESPG:26917).
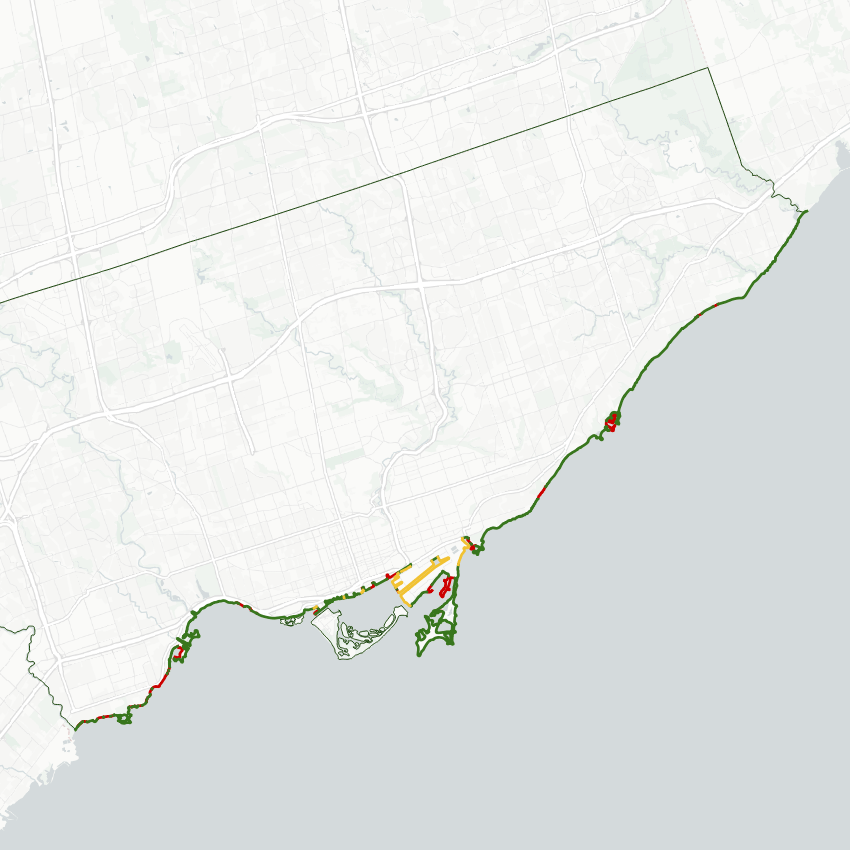
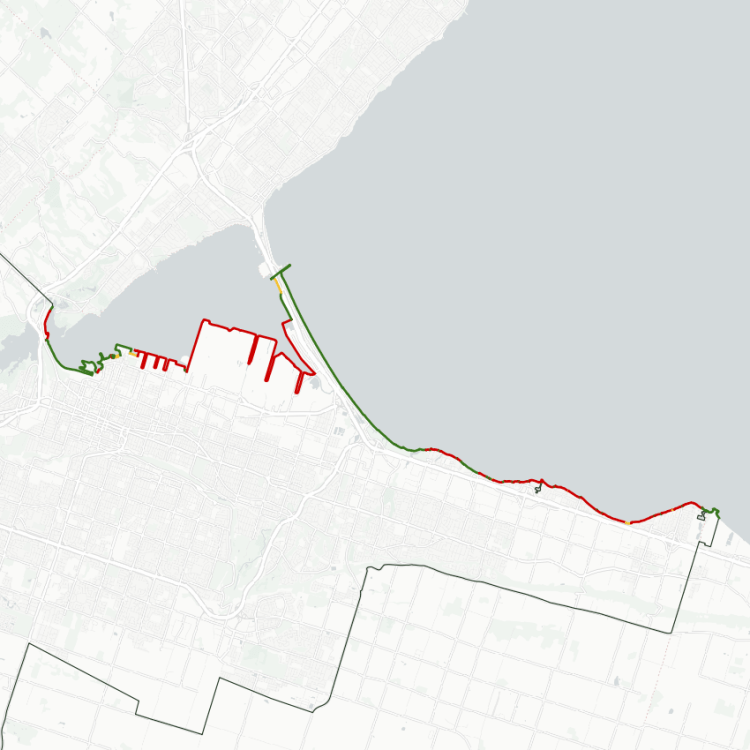
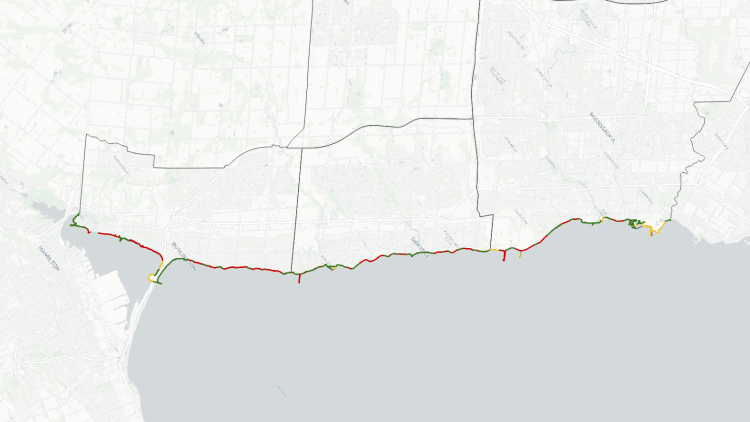
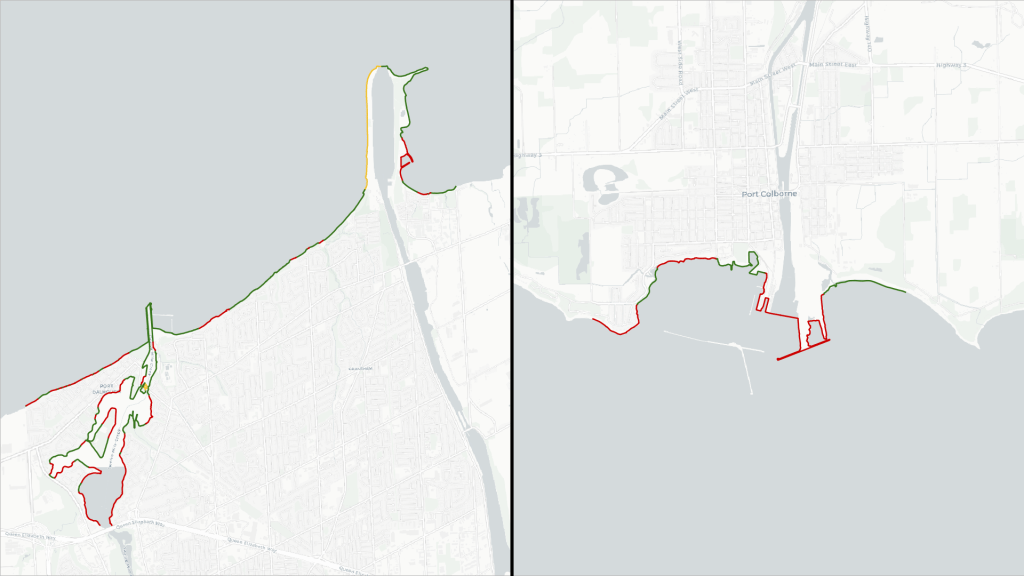
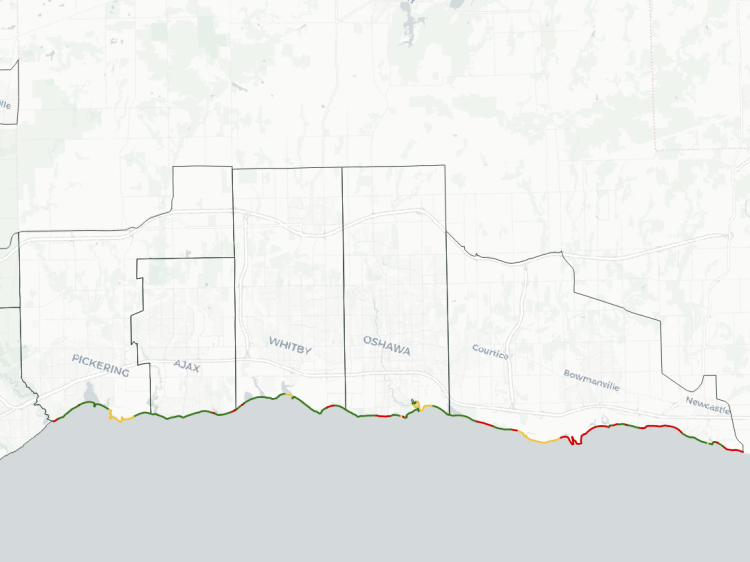
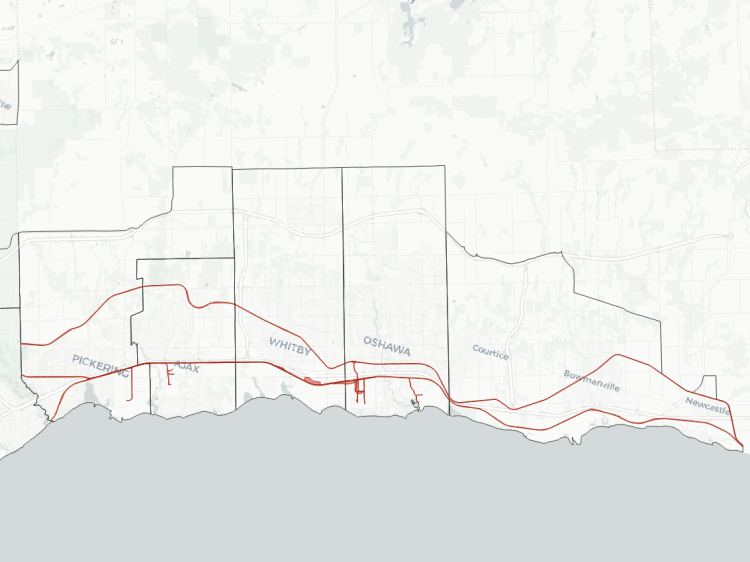
Shoreline
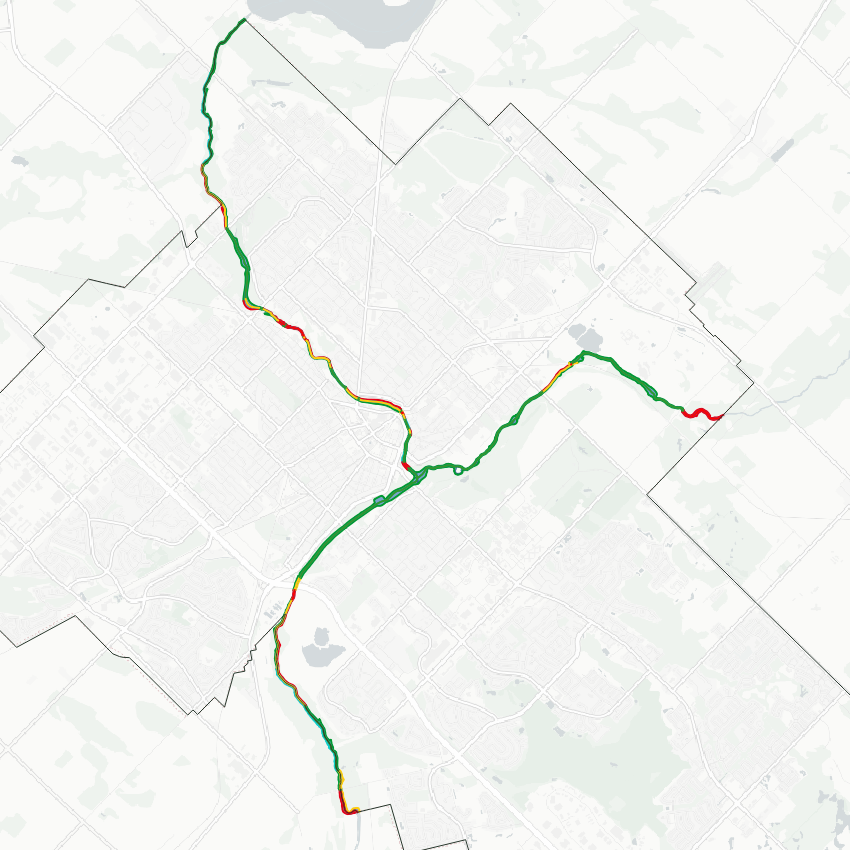
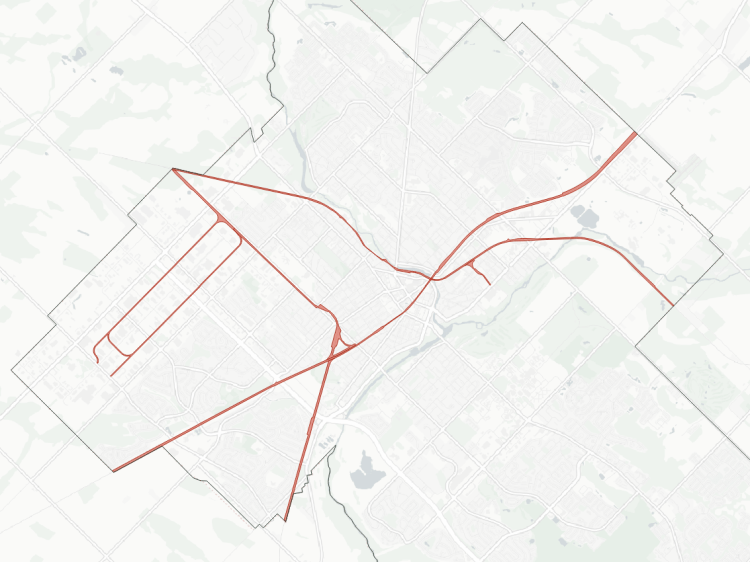
Riverbanks
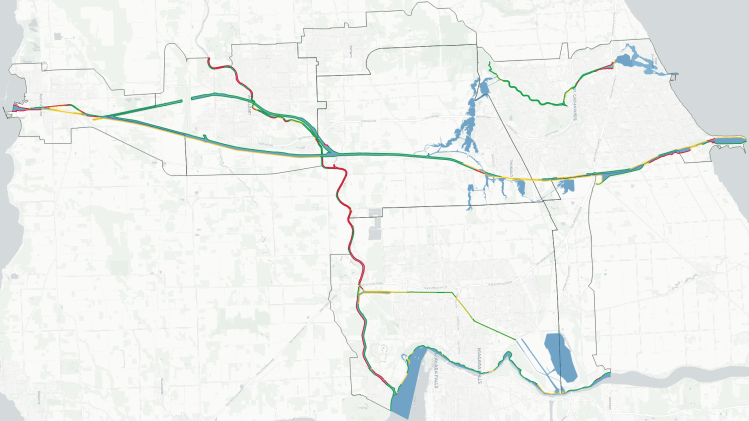
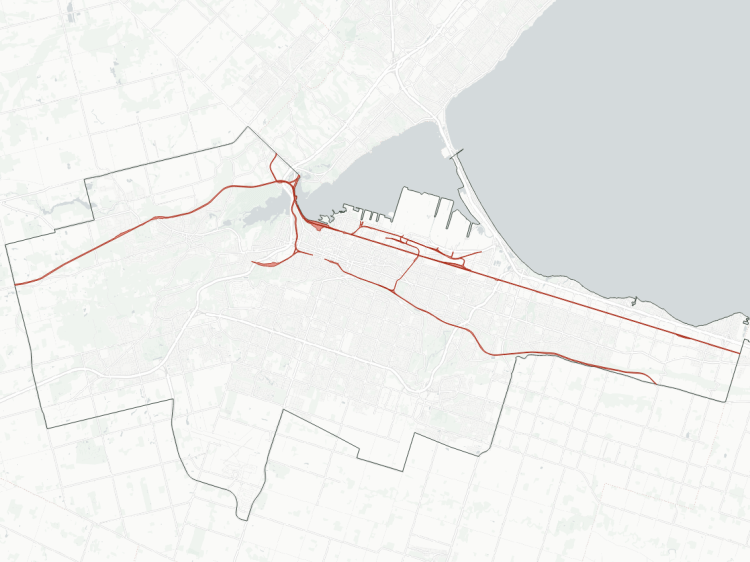
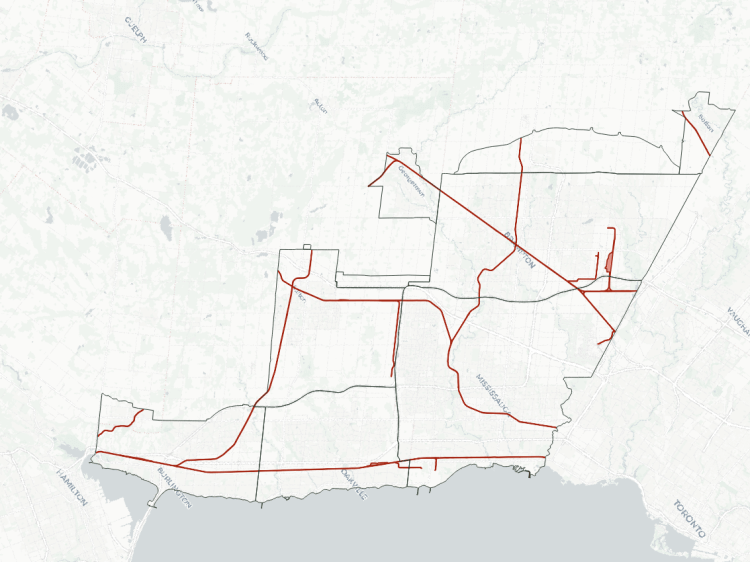
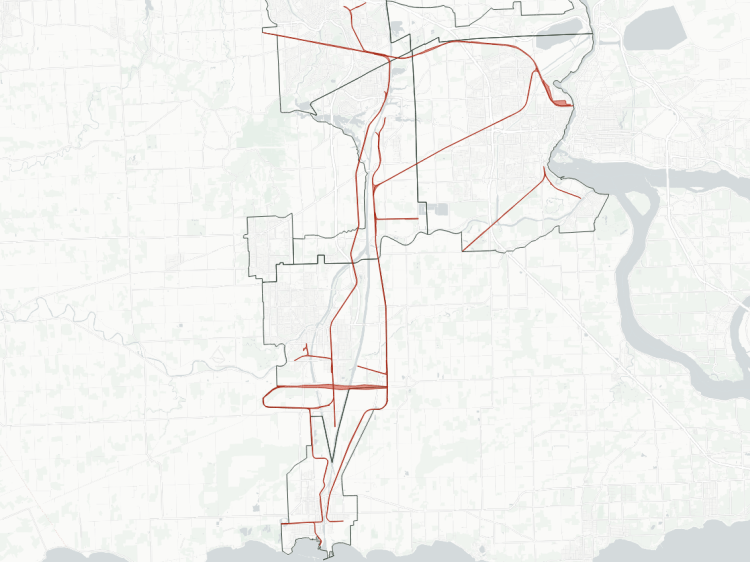
Utility Corridors
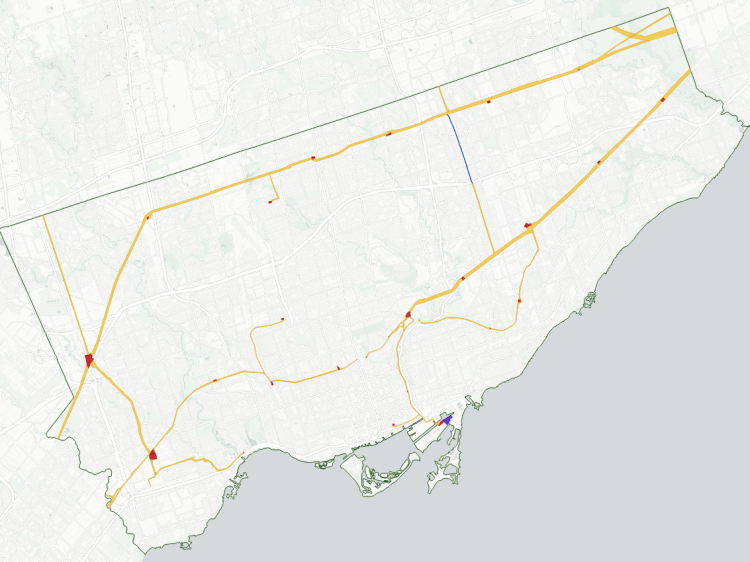
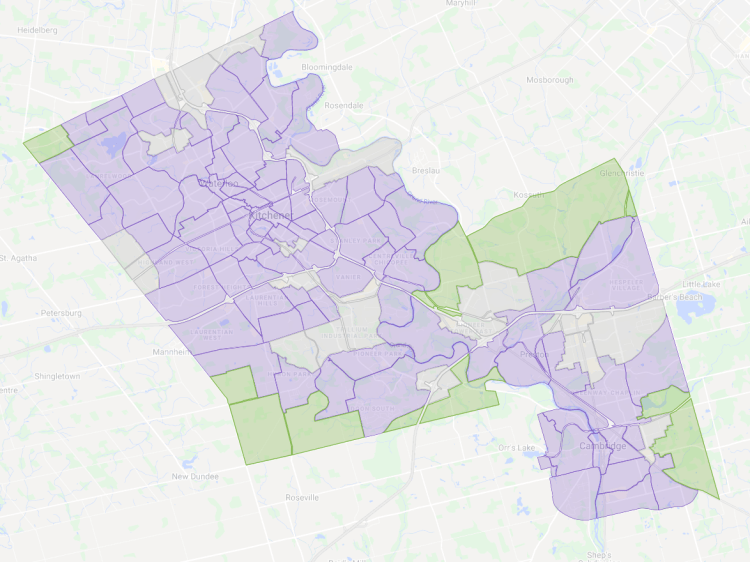
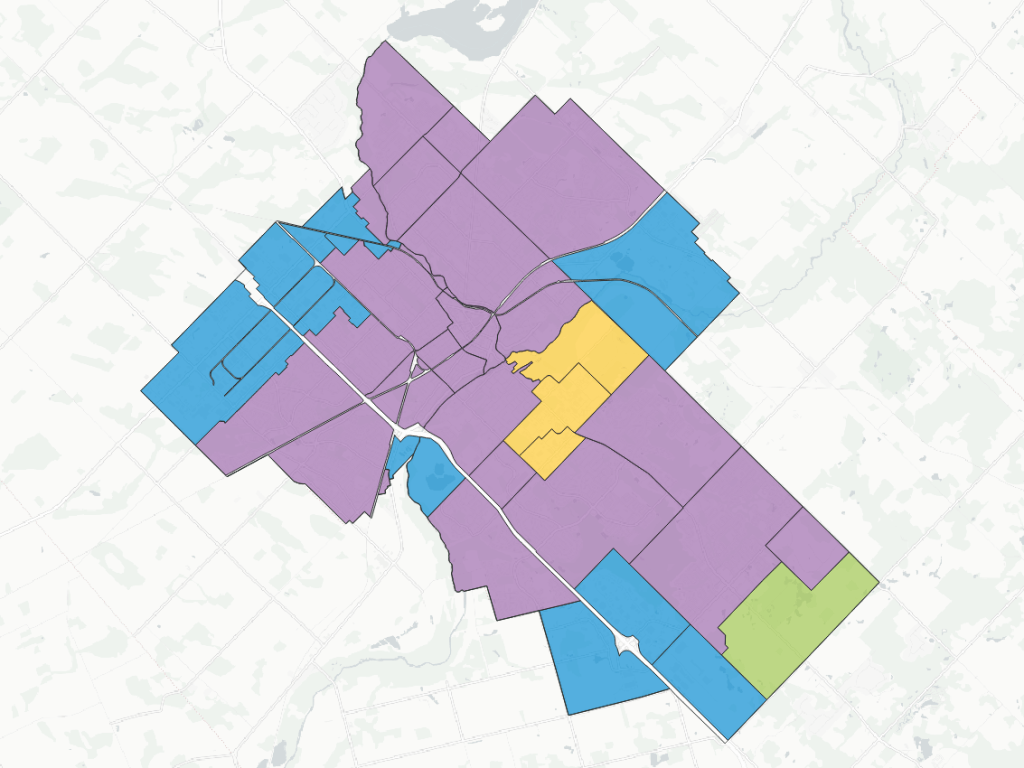
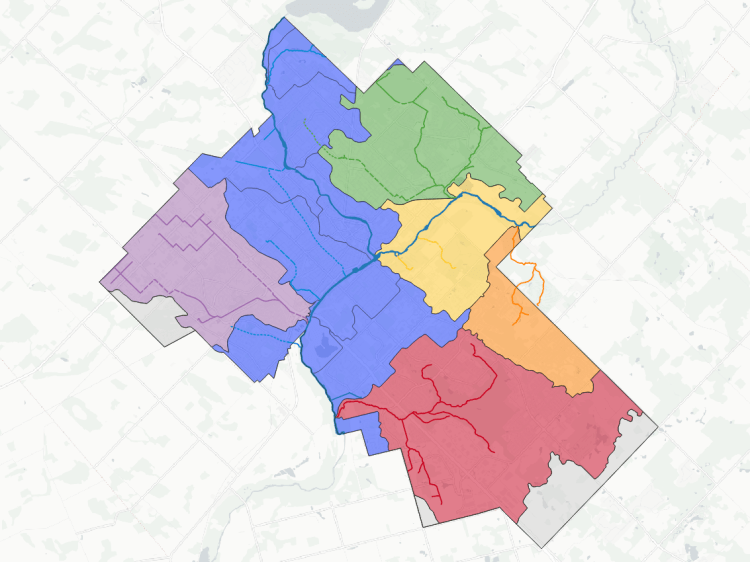
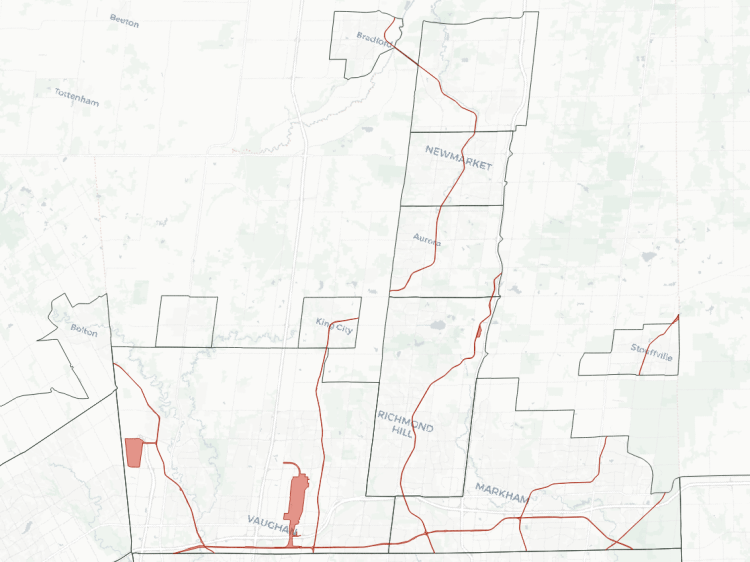
Neighbourhoods
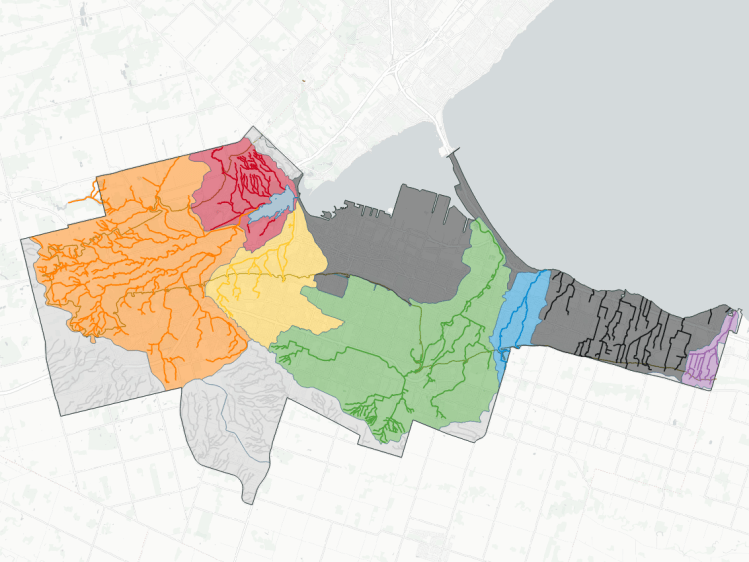
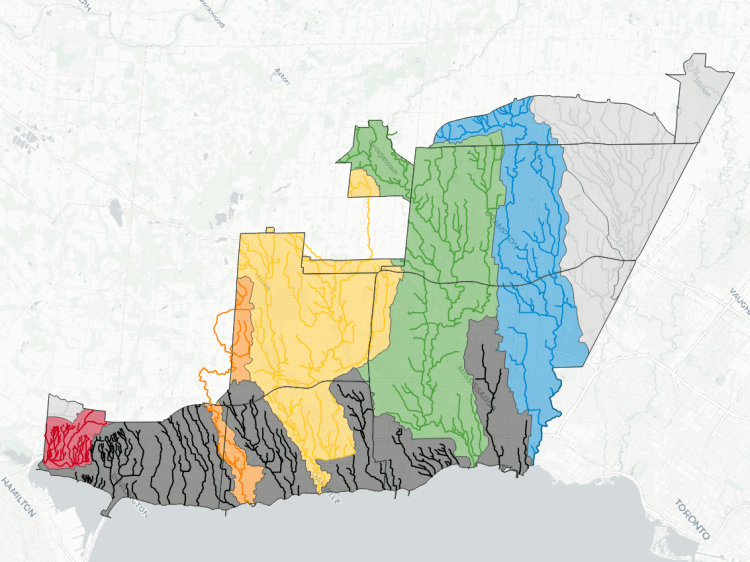
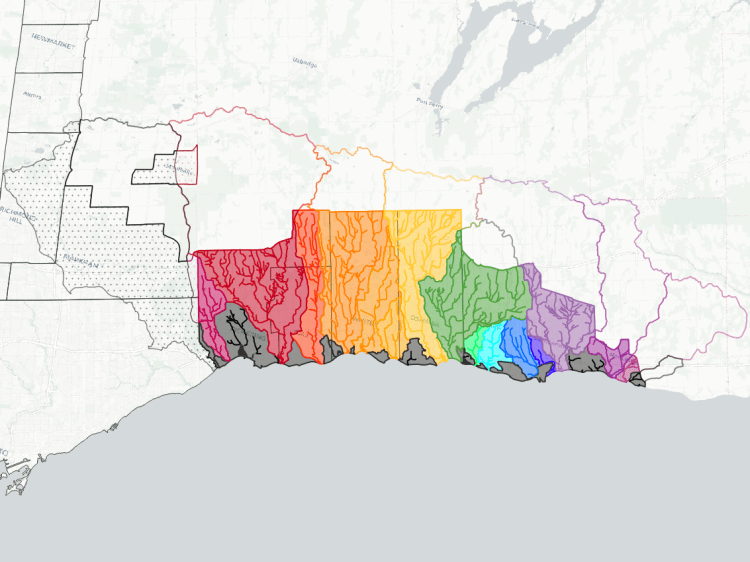
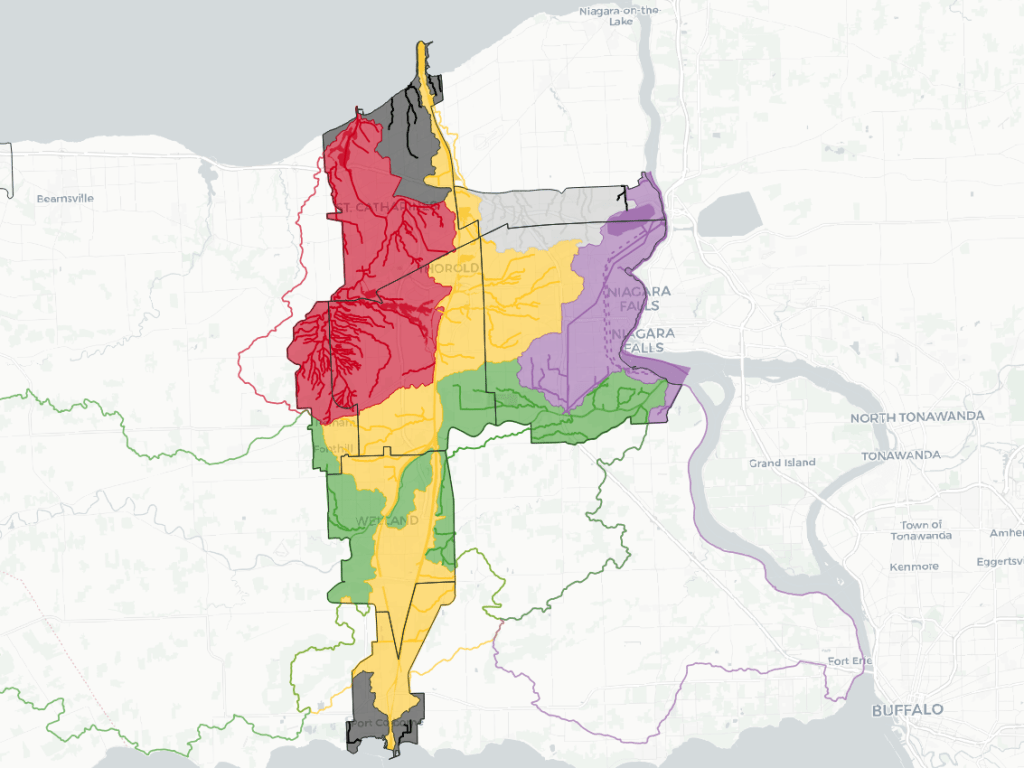
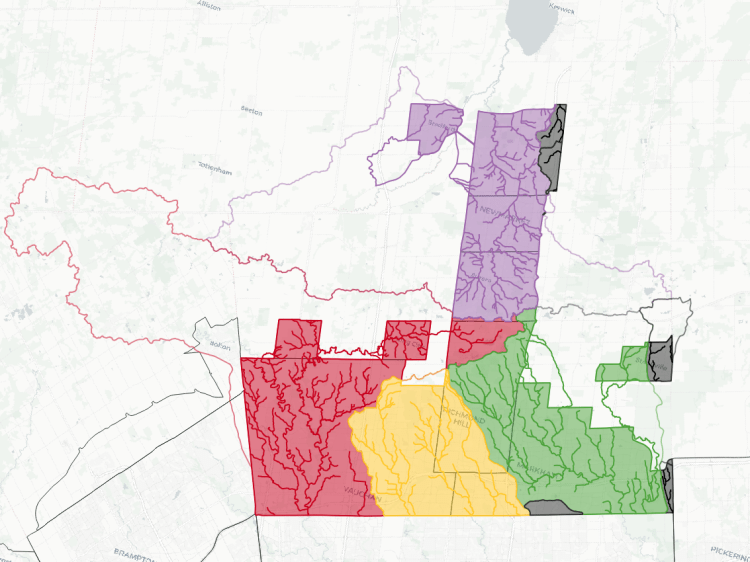
Watersheds


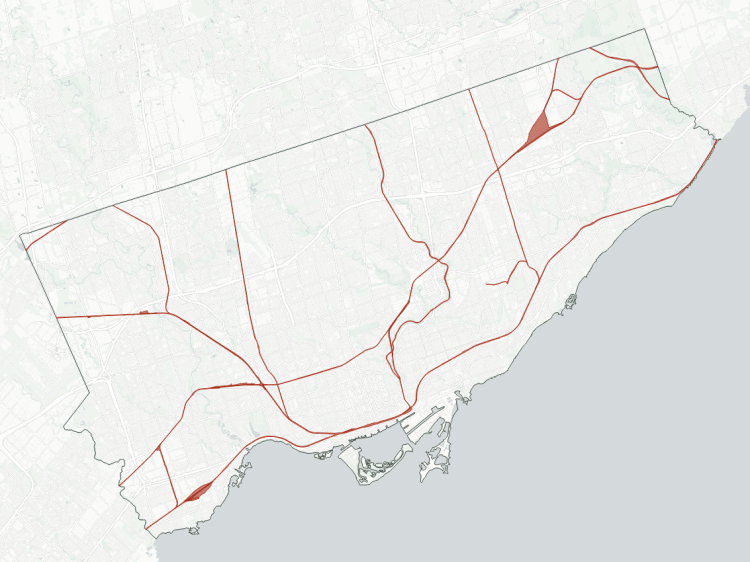
Railways

Blog Topics


