Disclaimer: This piece is a data analysis and open discussion regarding Lake Ontario levels. The conclusions are not definitive and are editorial in nature. The matters before the Supreme Court of the State of New York are unproven and may be tested in court through rigorous argument, expert testimony, and applicable law.
In 2017, Lake Ontario broke height records. Last summer, it did it again. I wrote a piece looking at the full picture of where Lake Ontario’s water comes and goes. In summary major contributors to those record levels were:
- An extended winter and late spring;
- Significant spring rain;
- Significant unregulated flow into Lake Ontario from Lake Erie;
- Significant unregulated flow into the St Lawrence from the Ottawa River; and,
- Restricted outflow from Lake Ontario to compensate for the Ottawa River.
It was the coming together of a bunch of factors. There was so much water rushing into the system, and not enough capacity going out, that it filled like a clogged bathtub. New York State, however, thinks that more could have been done. They’re suing the IJC, the bi-national agency in charge of operating Lake Ontario’s outflows at Moses-Saunders Dam near Cornwall.
So I’ve decided to pick up from my previous post, and look at some of the claims.
The Records and the Damage Done
As I wrote previously, Lake Ontario hit a new record monthly average lake height of 75.91 metres (Note 1) last June. That’s 10 cm above the previous record set in June 2017, 15 cm above the record set in 1952, and 1.15 metres above average (Note 2). So in 2017 and 2019, these record high levels caused flooding and erosion on both sides of the lake, including a whack of property damage on upstate New York’s shoreline.
This damage is not just because the lake is generally high. There’s also:
- Lake surge (or wind set-up), which is a significant tilting of the lake due to wind (see diagram below); and,
- Waves, which are self-explanatory.
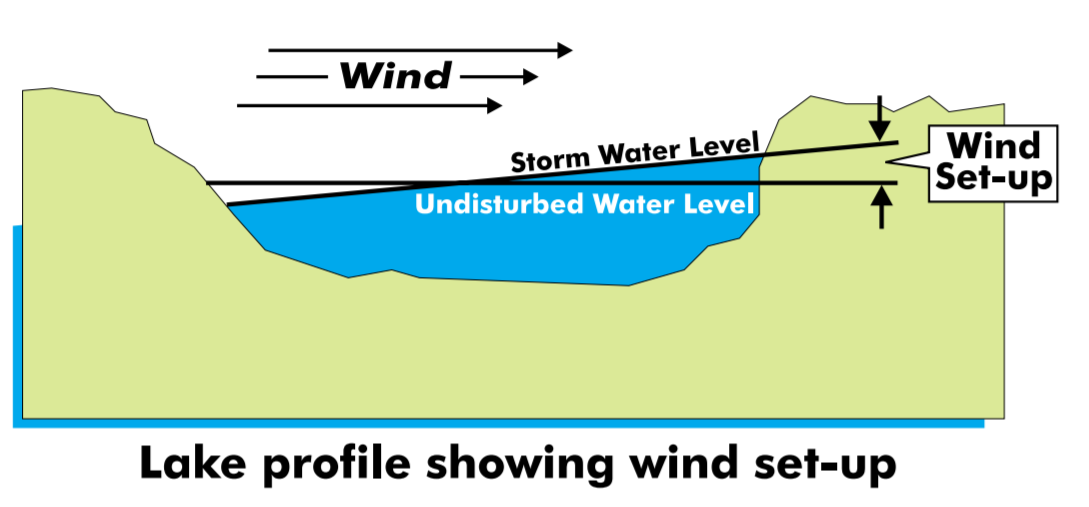
On top of lake levels being a half-metre above average levels, surges and waves can add well over an additional metre of height to the water, and that’s a powerful force to be reckoned with, causing devastating flooding and erosion during a single storm.
The Claims
Paragraph 2 of the lawsuit states:
“In the event of extremely high water levels in Lake Ontario, the IJC’s Dam operation protocol requires the Commission to operate the Dam to provide ‘all possible’ flooding relief to riparian property owners along Lake Ontario upstream of the Dam, subject only to protecting owners downstream of the Dam. During the severe flooding in 2017 and 2019…the IJC chose not to implement its flood relief protocol, which required the Commission to increase outflows through the Dam to the maximum extent possible.”
I don’t know about you, but it seems to me NY State undercut that second sentence with the first one.
The IJC’s ‘Dam operation protocol’ is called Plan 2014, and in a nutshell, when Lake Ontario reaches a certain height, the IJC is able to take certain actions to provide relief to Lake Ontario. This upper trigger varies every “quarter-month” or 7-8 days. Looking at last year’s data, it is true the dam wasn’t opened to full capacity when it reached the upper trigger; between May 7 and June 21, 2019. But again, providing “all possible” protection to Lake Ontario shoreline property upstream of the Dam is subject to protecting downstream properties on the St. Lawrence.
Opening up the Taps
Ignoring the downstream, what difference would it have made to open the dam to max capacity? Would it have been significant? If New York says not opening it up was negligent and the IJC says there was just too much bloody water, this is a good hypothetical scenario to test that.
Under Plan 2014, Lake Ontario would have hit the Upper Limit Trigger on May 7, when it surpassed 75.53 metres. Now, it would have fallen below that the very next day, as the trigger increased to 75.56, and the lake level was 75.55. But I’m going to ignore that. I’m also going to ignore the fact that, in this hypothetical situation, the hypothetical lake level resulting from max outflow bounces above and below the Plan 2014 trigger.
Let’s just assume that, on May 7, 2019, the IJC ignored all downstream impacts and opened up the Moses-Saunders Dam to its max capacity of 10,400 cubic metres a second. What difference would it have made?

31 centimetres, or a standard school ruler. That’s how much lower it would have been between June 21 and August 21, when the dam was opened to max capacity anyway, and less so from May 7 to June 21. The lake would have still been 55 cm above average, and it’s insignificant relative to surge and waves (Note 3).
Remember this is a scenario that would have devastated Montreal, which was already grappling with floodwaters, as well as other communities along the St Lawrence downstream of the dam.
What Arguments Hold Water
The theoretical scenario above illustrates a simple fact: there was a lot of water in the system. There’s no way to control how much water comes into Lake Ontario, from Lake Erie and all of the rivers and creeks on both sides of the border. This theoretical scenario also ignores other considerations the IJC has to make, such as potential downstream impacts, ice, hydroelectric plant equipment, and shipping / navigation.
This is consistent with the IJC’s position. From my viewpoint, New York State has a tough case in front of them. As a start, they have to prove that a) opening up the dam to its fullest extent would have made a significant enough difference to the property damages they faced, and b) it would not have significantly impacted downstream communities.
In the face of that challenging argument, it’s hard to see why New York State has gone through the trouble of this lawsuit. Giving them the benefit of doubt, perhaps they do have convincing data to show that extra discharge at the dam would have made a difference. Being really cynical, perhaps they don’t care how downstream communities in Quebec are impacted (the dam is about where the New York border turns east from the river).
I think it’s political, and I say that with respect.
Paragraph 74 of the lawsuit argues the IJC was negligent because “Among other things, the IJC…chose to prioritize commercial shipping interests over riparian property owners.” That would have been crazy to say back in the 19th and early 20th centuries, when marine shipping was still a major way of transporting goods. But in the 21st century when we have other means to move goods by road, rail and air, I think it’s a fair question to ask if accommodating ships during critical lake conditions is reasonable.
Maybe that still wouldn’t make a huge difference, but it’s a difference nonetheless. And perhaps that’s one reason amongst others to step back, look at the bigger picture, and have a political discussion about how to manage flooding and flows in the Great Lakes basin.
That discussion should also include how New York manages it’s shoreline development. The best way to avoid a flooding or erosion hazard is to avoiding or mitigating the damage before development occurs. How much damage could have been prevented has been the burning question for me.
Note 1: All heights are in the International Great Lakes Datum (IGLD), 1985. Data is based upon measurements at master gauge 9052030 in Oswego, NY, obtained from the NOAA – Great Lakes Environmental Research Laboratory.
Note 2: Averages are for 1917-2016 (100 years). The annual lake average was 74.76 m. Monthly averages are different and vary month-to-month.
Note 3: This is a calculation based upon a surface area of 18,960 km². The difference between the max outflow from the Moses-Saunders Dam and the last outflow change for the dam was applied for each day (i.e. outflow in M3/s, multiplied by 86,400 seconds in a day), for a total volume of discharge for that day. This was then calculated as a height (volume ÷ area), and subtracted from the previous day height. The actual height change that occurred that day was also subtracted to account for inflows and evapotranspiration.
