Note: This post was first published on June 1, 2019 with data available from May 30, 2019. It was updated on June 3, 2019 with the latest data available, and improved graphs. It was updated again on June 5, 2019, July 2, 2019 and February 17, 2020 to reflect new height records and revised data from sources.
In June 2017, Lake Ontario rose to a height not seen in the last 100 years of recorded history. The pictures of how this impacted Toronto were dramatic; flooding parks, eroding shorelines, and boardwalks, beaches and the Islands underwater.
Two years later, we broke records again. Once again, it’s a shocking scene.
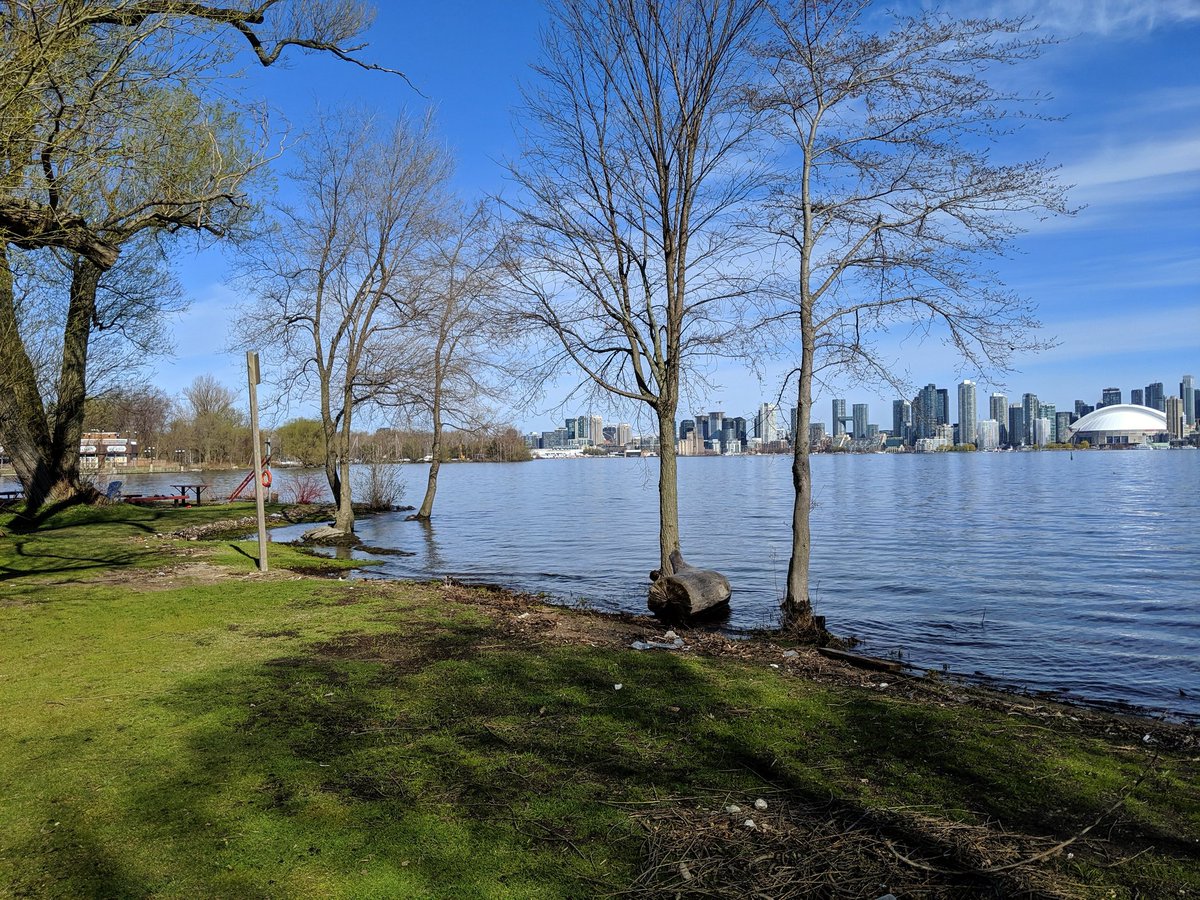

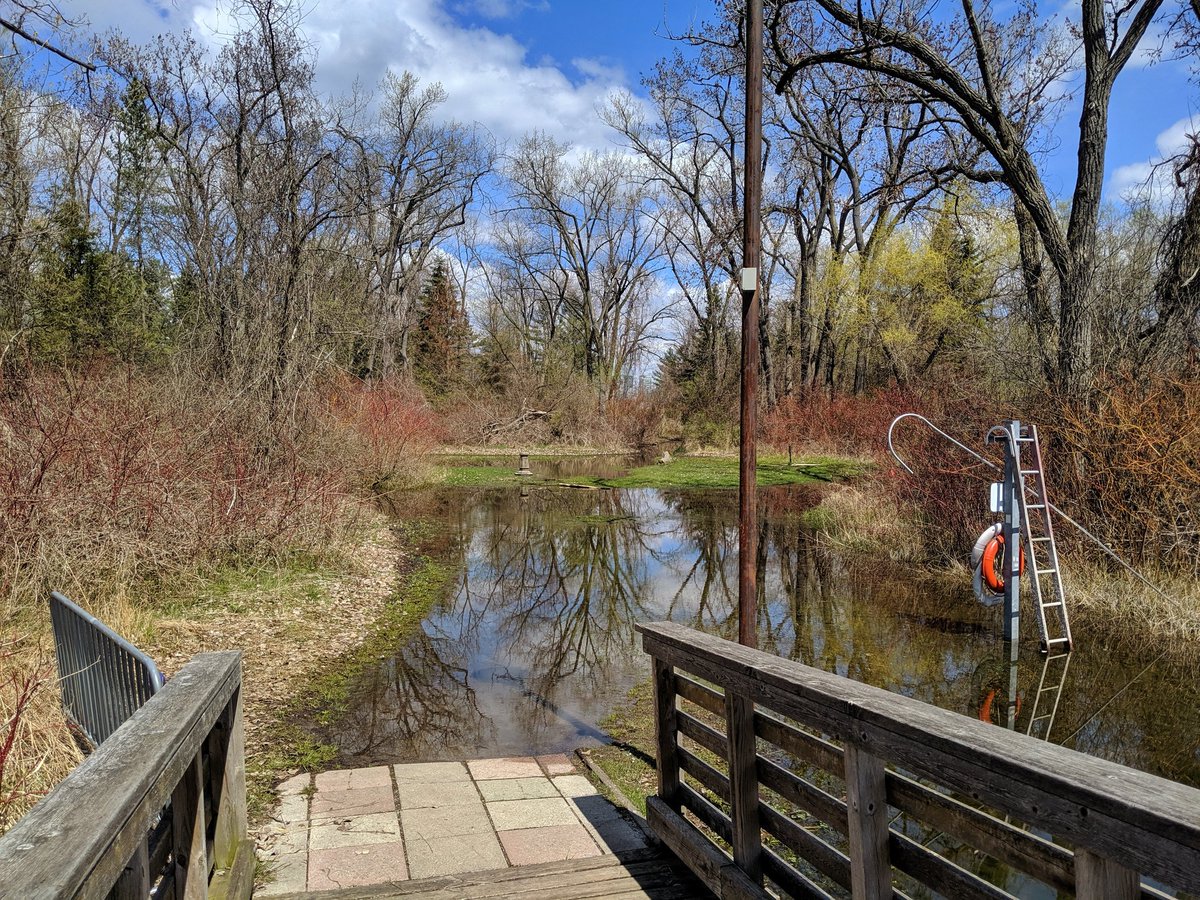
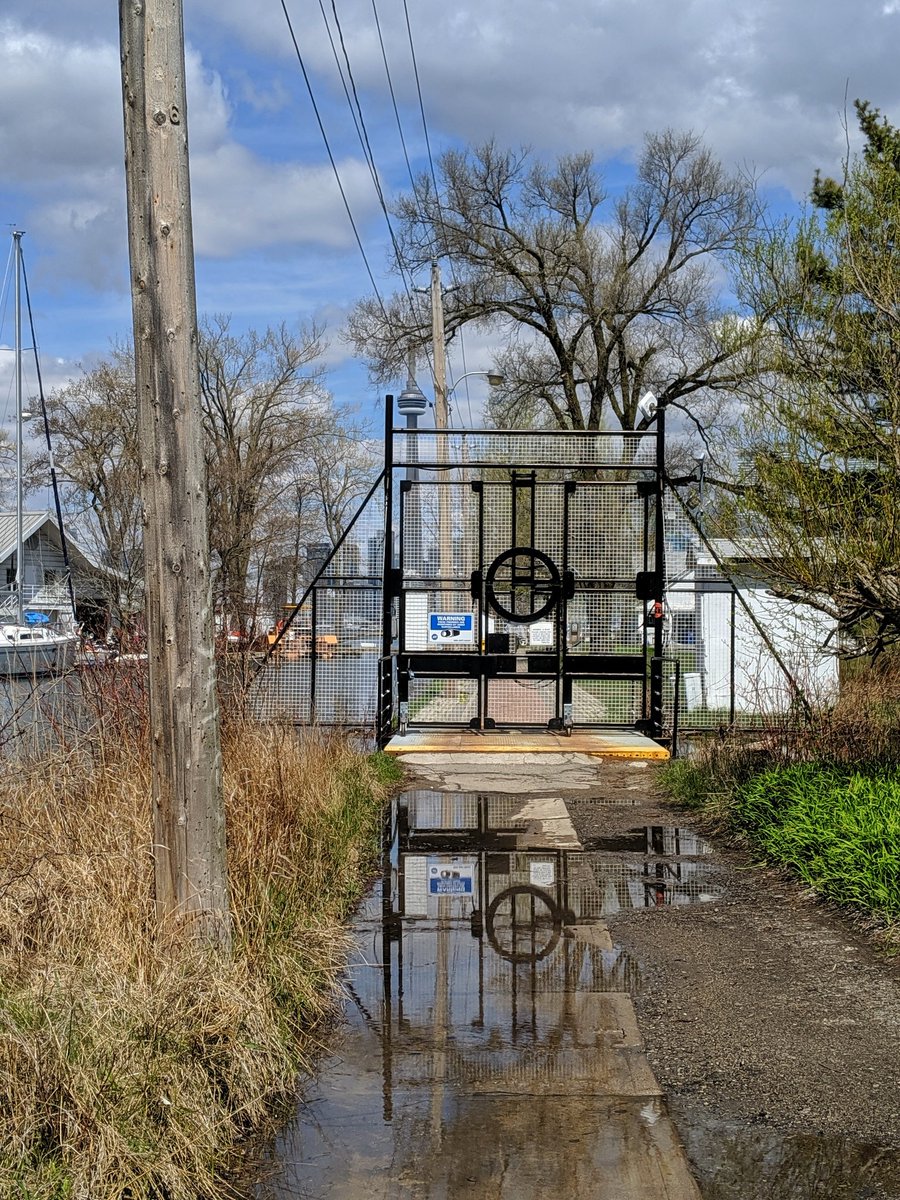
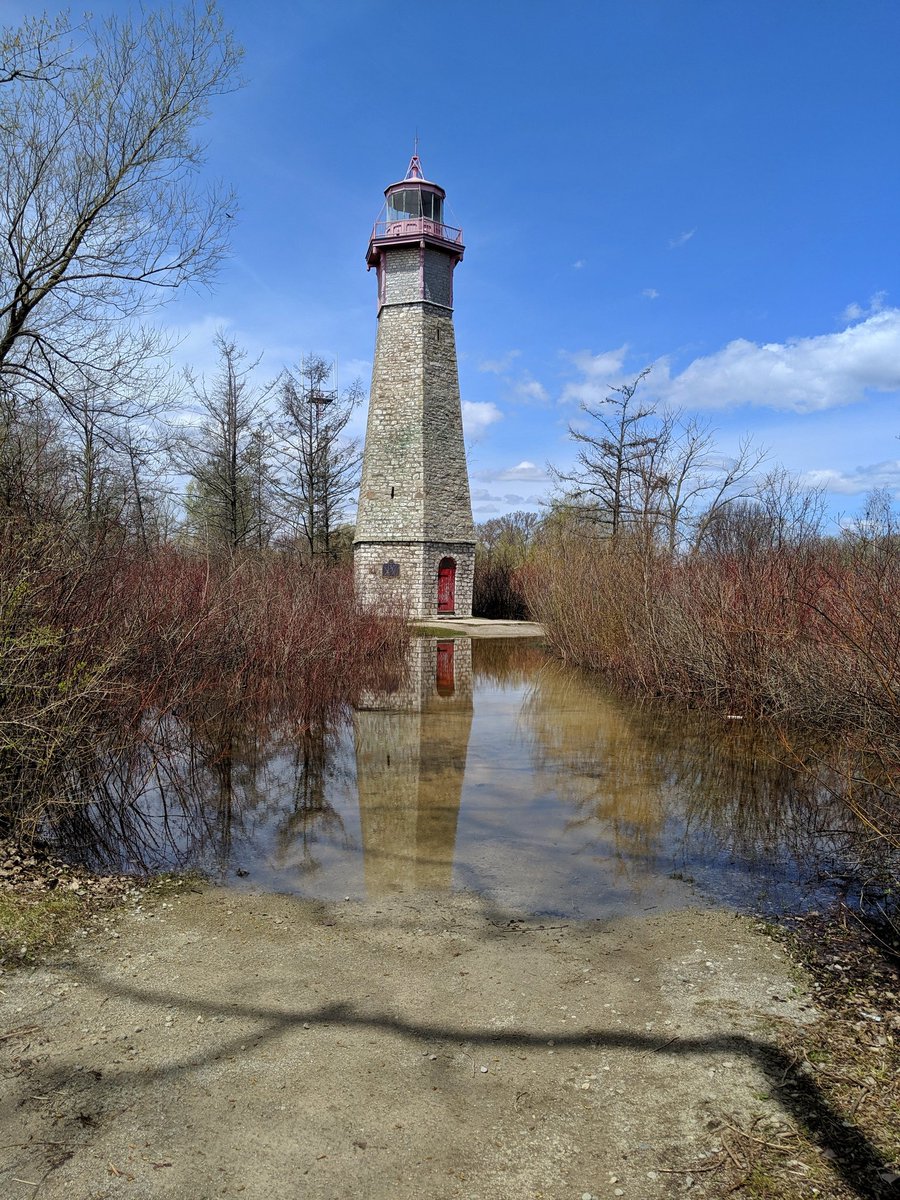
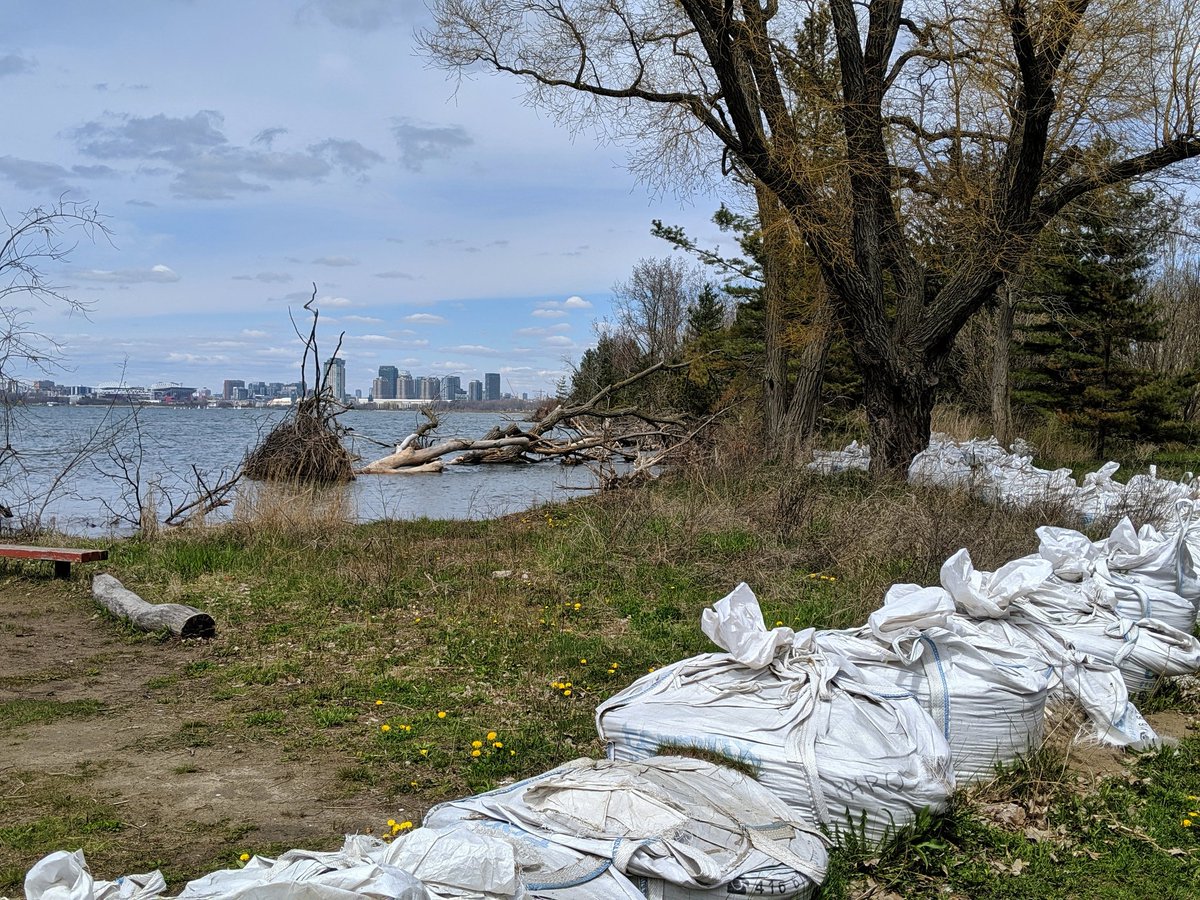
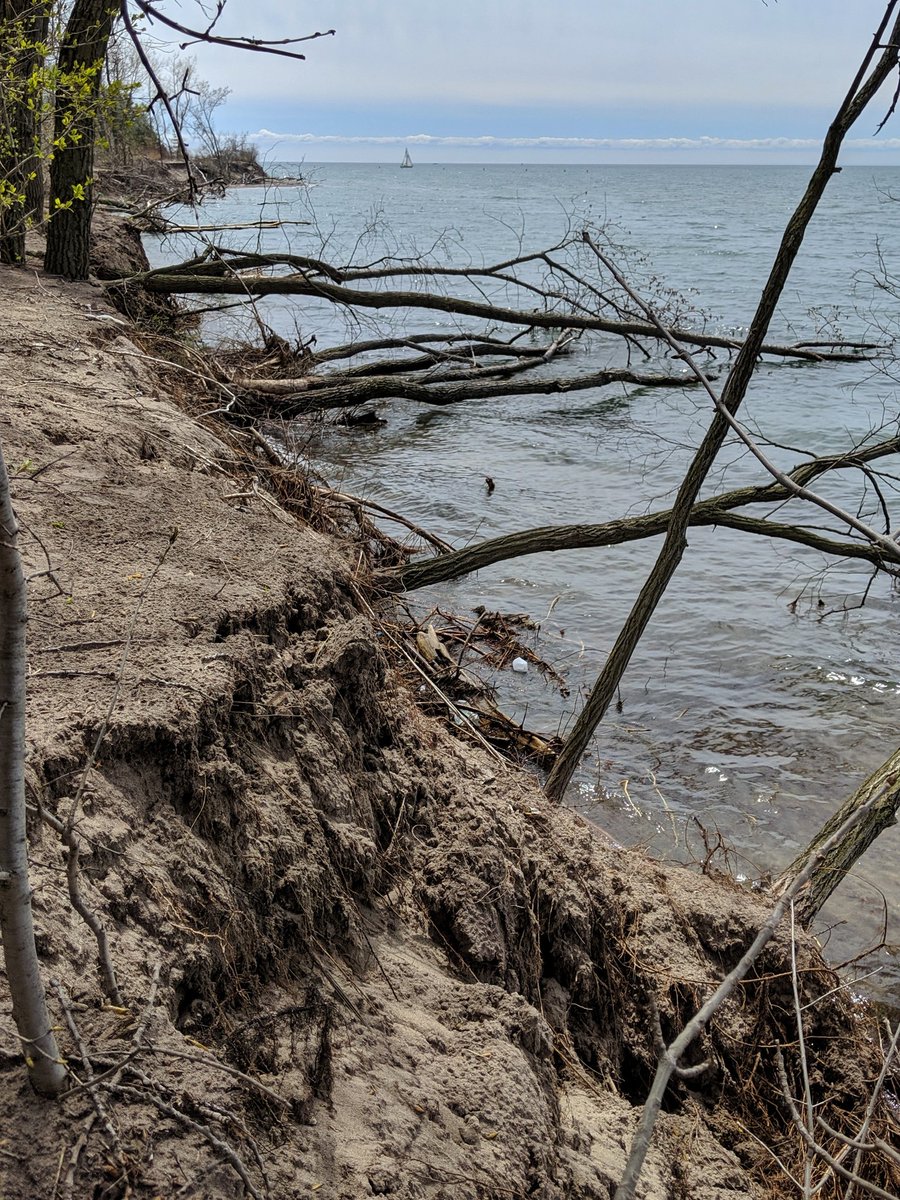
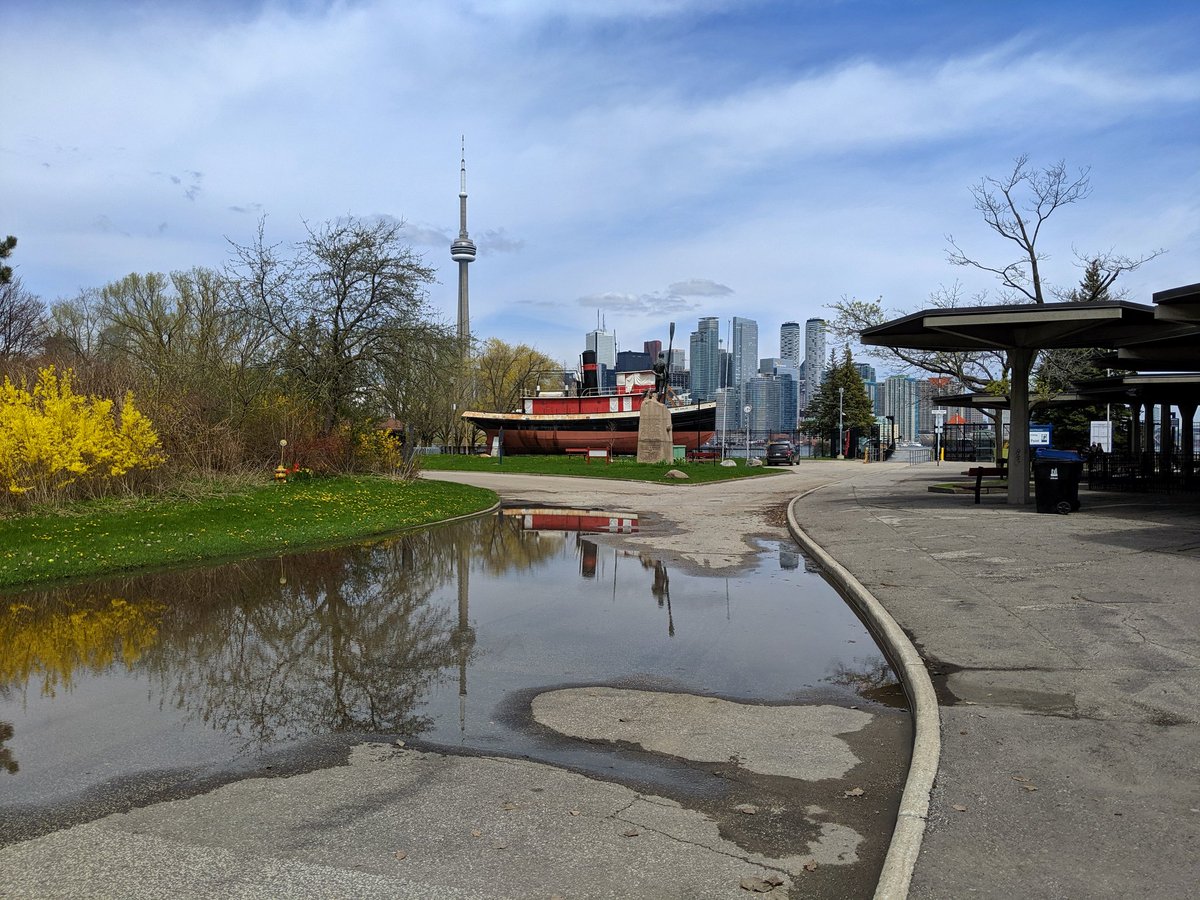
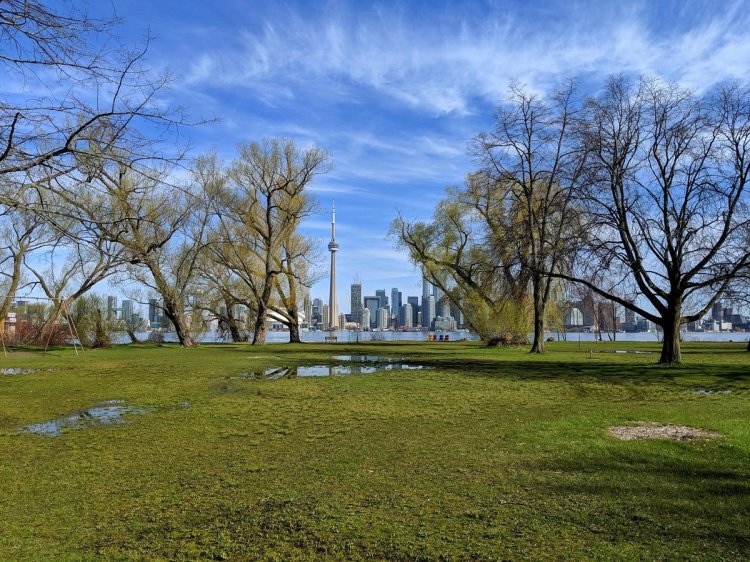
See more from this walk around the Toronto Islands
2019/05/11 – The Islands
The height of water in a lake fluctuates naturally. The amount of rainfall flowing into it, and the rate at which it drains through an outlet (if it has one) is a major determinant. However, it can also be affected by temperature, sunlight, formation / melting of snow and ice, and wind.
But how have we hit crazy high levels within the last two years? Rain, and how much and how hard it falls, is definitely a huge factor. But you may be surprised to learn that its less about the rain that falls onto Lake Ontario’s surface and shores or how hard it fell, and more about what’s happening to the east and the west.
This is a look at where water in Lake Ontario comes from, and where it goes.
The Setup
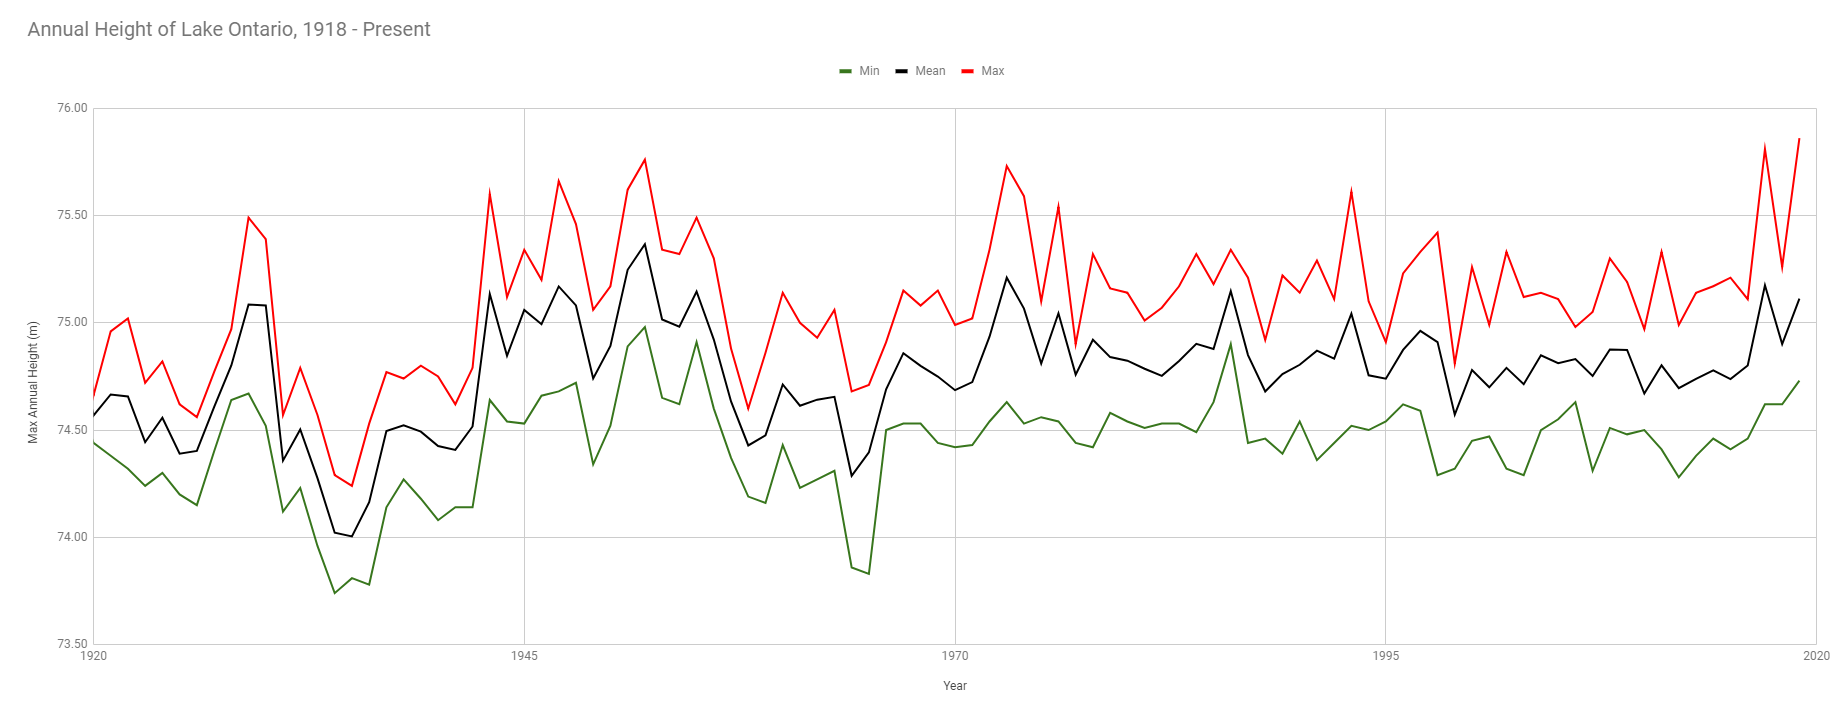
First, let’s set this up with some historical context on Lake Ontario’s water level (Note 1).
Prior to 2017, Lake Ontario had only gone above a height of 75.7 metres twice in the last century: 1952 and 1973. It has also only gone below 73.8 metres twice during the same period: 1934 and 1936. Otherwise, Lake Ontario has varied in height within this 1.9 metre range from year-to-year, and season-to-season.
Then in 2017, the previous record set in 1952 was broken by 5 centimetres, with the lake reaching a monthly average height of 75.81 metres above sea level. It was dramatic and visually striking, flooding the Toronto Islands and other shoreline areas on the mainland. The capital repair costs to the city were estimated to total $15.6 million.
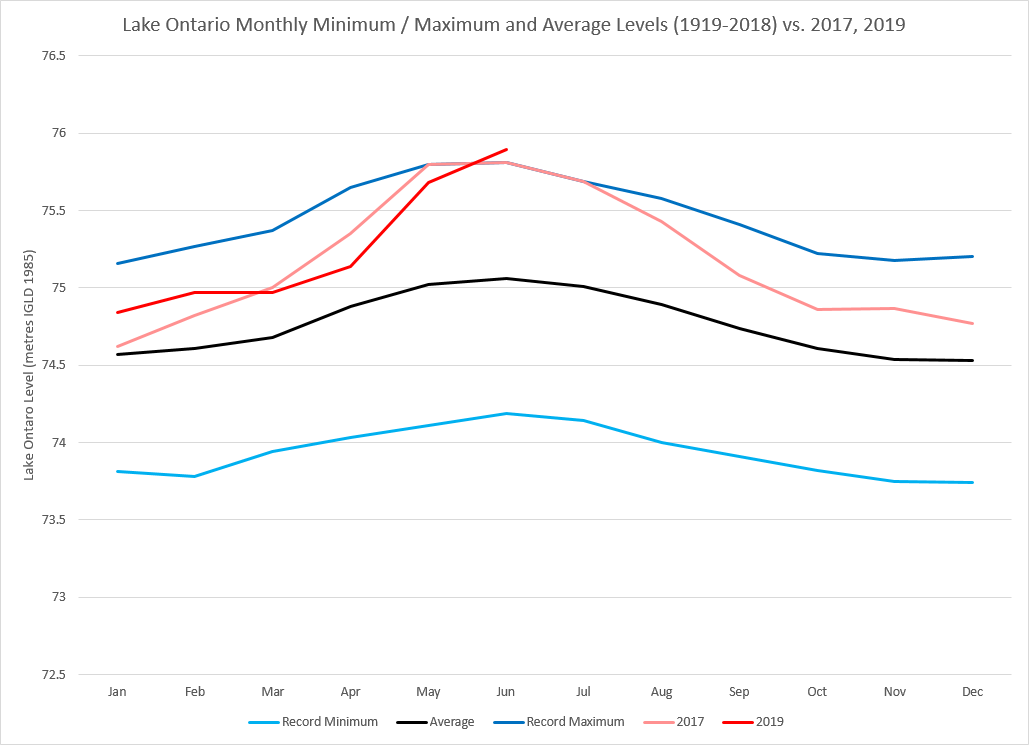
This year, the high lake levels are repeating themselves. Most days in June 2019 broke Lake Ontario’s previous daily height record of 75.88 m set in 2017. June 2019 also saw a new record average lake height of 75.91 m, or 10 cm above the previous record set in June 2017.
Looking back makes you realize that in Lake Ontario’s history, a couple pairs of high level years occurring in close vicinity is not unprecedented. 1929 + 1930. ’43 +’ 47 + ’52. ’73 + ’74 +’76. Keep the last two sets in mind next time you’re looking at imprints on Toronto’s bridges and culverts. Same story goes for sets of years with record lows.
What causes the changes in Lake Ontario to swing so much? Do I really need to bust out that graphic from your high school science class showing the water cycle? No? Good.
But as I alluded to, Lake Ontario’s water level isn’t affected as much by the rain that falls near the lake. Below is a chart showing the water balances for the Great Lakes.
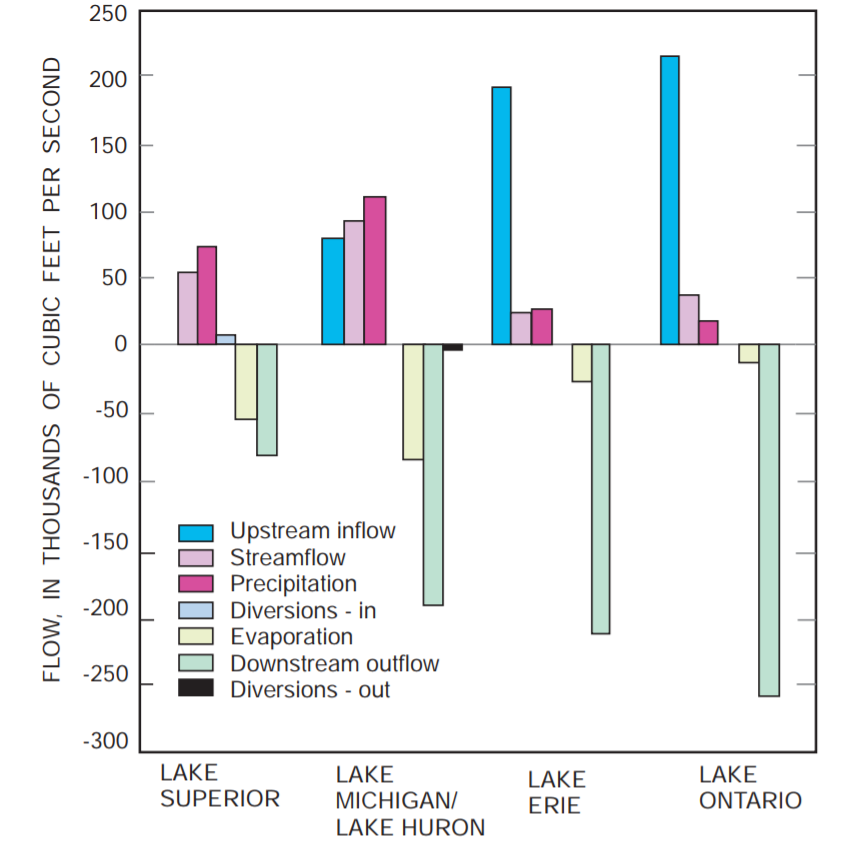
As you can see, Lake Ontario’s levels are highly dependent on upstream inflow and downstream outflow (79% and 95% of total inflows and outflows, respectively). The remaining 21% of the total inflow is from water fed from rivers and streams, and 5% of the total water is evaporated (Note 2).
Upstream inflows come from the other Great Lakes, which are fed by rainfall and streamflow. So technically, it makes it an indirect impact. But it’s an important distinction to make. A closer look at where Lake Ontario’s water comes from and where it goes will make it clear why.
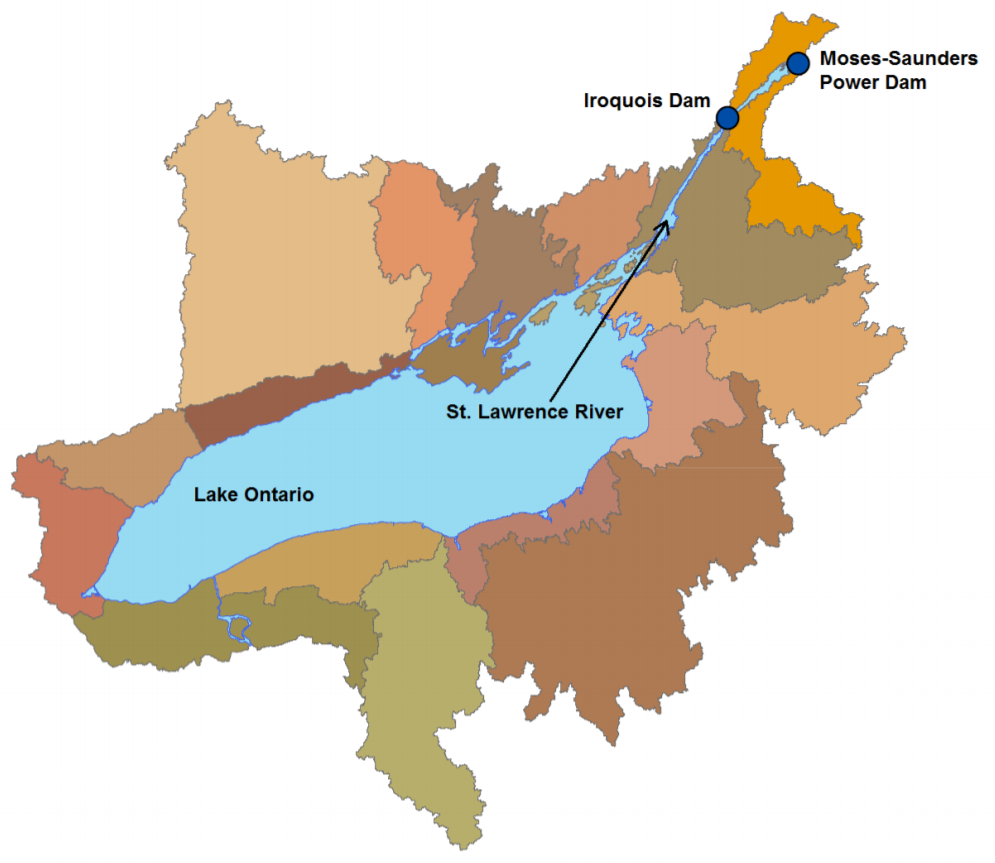
Ontario: Last Stop Before the St Lawrence
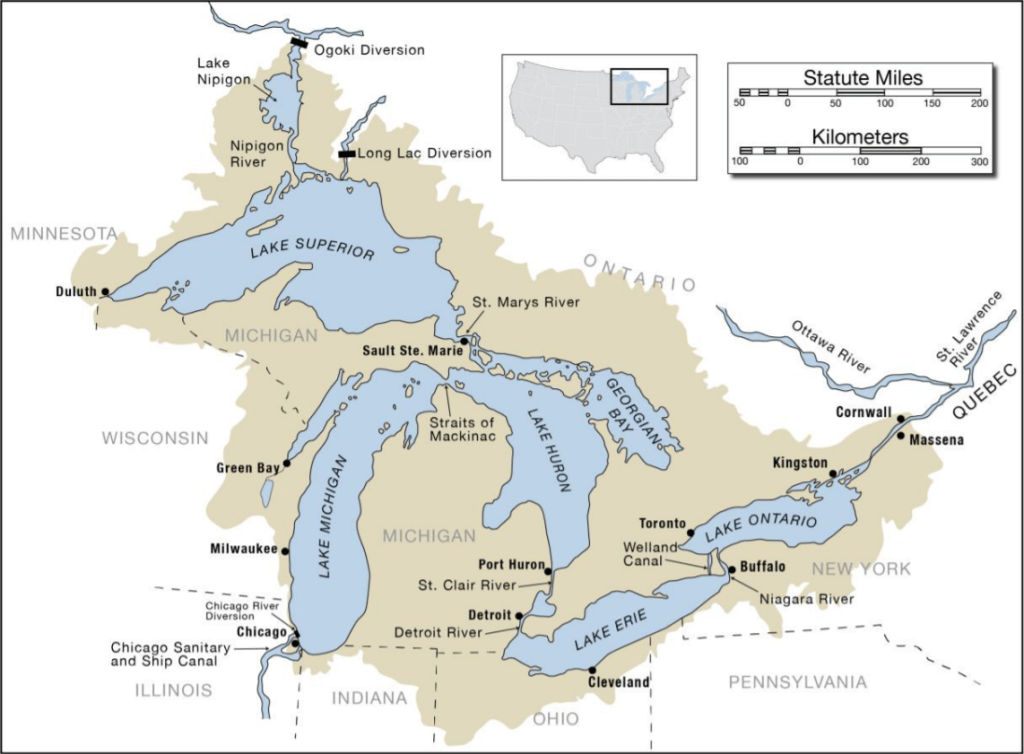
Lake Ontario is impacted by the fact that it is part of Great Lakes-St Lawrence River system. This means it is fed by water from (going upstream):
- Lake Erie via the Niagara River;
- Lake St Clair, via the Detroit River;
- Lake Huron / Georgian Bay, via the St Clair River;
- Lake Michigan, via the Straits of Mackinac; and,
- Lake Superior, via the St Mary’s River.
Water from Lake Erie flows down the Niagara River, and its mostly unregulated, meaning it flows without anything really holding it back (i.e. a dam). Two exceptions are hydroelectric power plants on both the Canadian and American sides, as well as the Welland Canal. However, the power plants are restricted in how much water they take in; the International Join Commission (IJC) is a bi-national agency that has rules to ensure there is enough water flowing over Niagara Falls, so they look pretty and aren’t a pathetic dribble.
Furthermore, they don’t have much capacity to hold what flows down the Niagara River, and they have to let it go eventually. It only manages to change the flow +/- 5%.
The Welland Canal is another pathway for water between Lakes Erie and Ontario. It isn’t a huge factor either; it’s 8.5% of what flows through the Niagara River (Note 3).
Continuing upstream, Lake Huron and Lake Michigan are technically one lake, as they are hydraulically connected through the Straits of Mackinac and generally sit at the same level. The water from them flows unregulated through the Lake St Clair and the St Clair and Detroit Rivers.
Lake Superior is the one major upstream part of the basin that is regulated. Outflow is controlled via three power plants and a 16-gate dam on the St Mary’s River. However, the outflow of Superior pales in comparison to other inputs to Lakes Michigan, Huron and Erie, and even then, any water held back would be a percentage of that outflow.
All that to say Lake Ontario is fed by the other lakes and the rainfall that feeds into them, and there’s really nothing holding it back. So when all of the lakes are up, it can mean a significant cumulative height difference for Lake Ontario.

Outflow: A Balancing Act
Lake Ontario, and all of the water fed into it, flows into the St Lawrence River, and eventually the Atlantic Ocean. But it’s not as simple as draining a tub.
While the eastern end of Lake Ontario is defined as being at Kingston (where it passes both sides of Wolfe Island), there are locks and dams along the way, which widen the St Lawrence River behind them and form ‘lakes.’ These lakes are:
- Lake St Lawrence, between Kingston and Cornwall
- Lake St Francis, between Cornwall and Melocheville
- Lake St Louis, along the west end of Montreal Island.
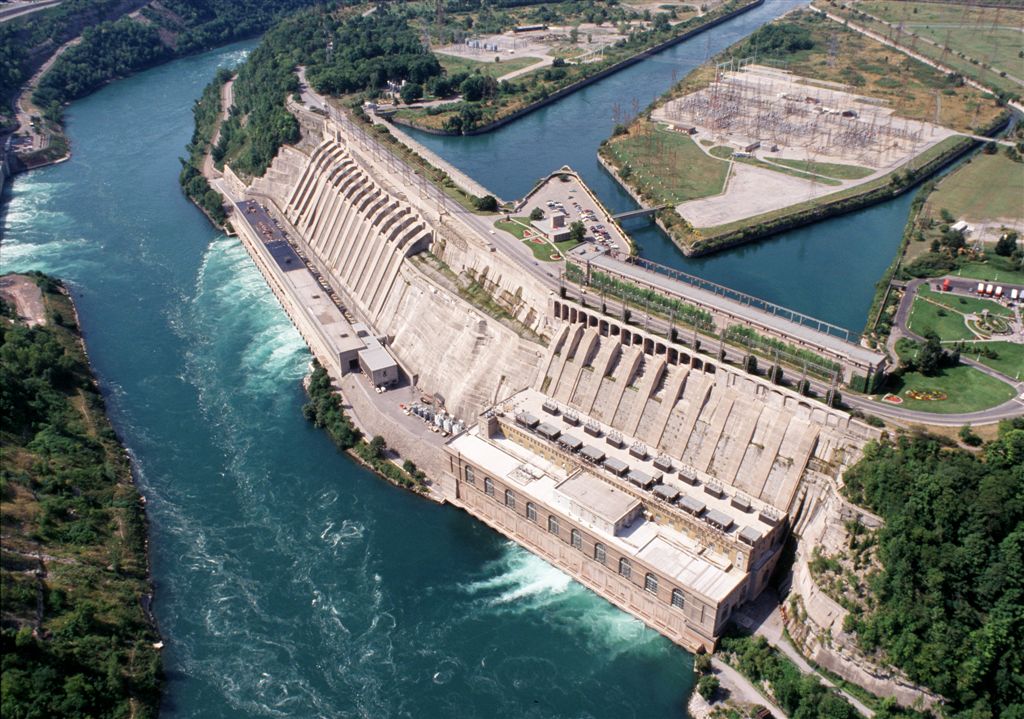
The key outlet is at Cornwall, between Lake St Lawrence and Lake St Francis, where the Moses-Saunders Dam controls the flow of water. How much water is released is once again determined by the IJC, but unlike the Niagara River, that goal is not making pretty waterfalls. Nor is it just contingent on what is happening to the west. The IJC has to play a balancing act between the height of Lake Ontario and how high the St Lawrence is downstream.

Lake Ontario is 19,000 km² and an average depth of 86 m. Lake St Francis and Lake St Louis on the other hand are…not so big. I couldn’t find the figures I was looking for, but it’s in the ballpark of 400 km² and an average depth of 10-20 m (if you got better numbers give me a shout). But the magnitude speaks for itself; the same amount of water has a disproportionate impact on water levels.
Even if Lake Ontario is really high, increasing outflow to reduce its height by a couple centimetres could send downstream communities underwater. So even if the Toronto Islands are underwater and our shorelines are being eaten away by erosion, it’s a small cost relative to the damage that could occur down in Quebec.
Another complicating factor is that the Ottawa River meets the St Lawrence at Lake St Louis. It is a very large river basin which is also relatively unregulated, and it can significantly alter the height of the St Lawrence at Lake St Louis. If there are already high flows coming down the Ottawa River, this put extra restrictions on the flow out of the Moses-Saunders Dam so that flooding in Montreal and other Quebec communities downstream doesn’t occur or isn’t worsened.
Seasonal Impacts
One mitigating factor in all of this is the evaporation off of the lakes. One would think that warm temperatures mean big thunderstorms, and that is a major pathway for moisture to be carried out of the lake. Well, actually it’s quite low.

Just as snow melt starts entering the system and the rain begins to fall, evaporation rates nosedive, and whatever goes through a lake’s outflow is the only output of the system. When you put the plug in the tub while the water’s still pouring in, it’s gonna fill up.
The manner in which snow falls and melts can also have an impact on the system. I reached out to a friend who is more academically trained in earth and atmospheric sciences to expand on these effects of seasonal change on lake levels.
“A late start to spring and extended cold weather can delay local vegetation’s break from dormancy. This has the effect of reducing evapotranspiration rates early in the season. As plants take up water, they remove some moisture from the ground which would otherwise end up in local river systems, and eventually through to the St. Lawerence River.
Alex Harris, B.Sc.(Env.), M.Sc. – Ecology candidate
An extended winter may also delay snow melt timing, resulting in a greater surge of water into the Great Lakes, as opposed to the longer, drawn-out thaw that we are typically used to.
Downstream damming and excessive rainfall are much more significant contributors to lake level issues. Still, evapotranspiration and snow melt play an important part in our water cycle, and all of these factors together may have helped pushed things over the top this year.”
The Perfect Storm
Putting it all together, you get an idea of why 2017 and this year saw crazy high water levels in Lake Ontario.
- Extended winter and late spring
- Significant spring rain
- Significant unregulated flow into Lake Ontario from Lake Erie
- Significant unregulated flow into the St Lawrence from the Ottawa River
- Restricted outflow from Lake Ontario
And when you put this in chart form, with the lake level put against the rates of inflow and outflow, it becomes clear how restrictions at the Moses-Saunders Dam can play a large part in raising Lake Ontario’s height.
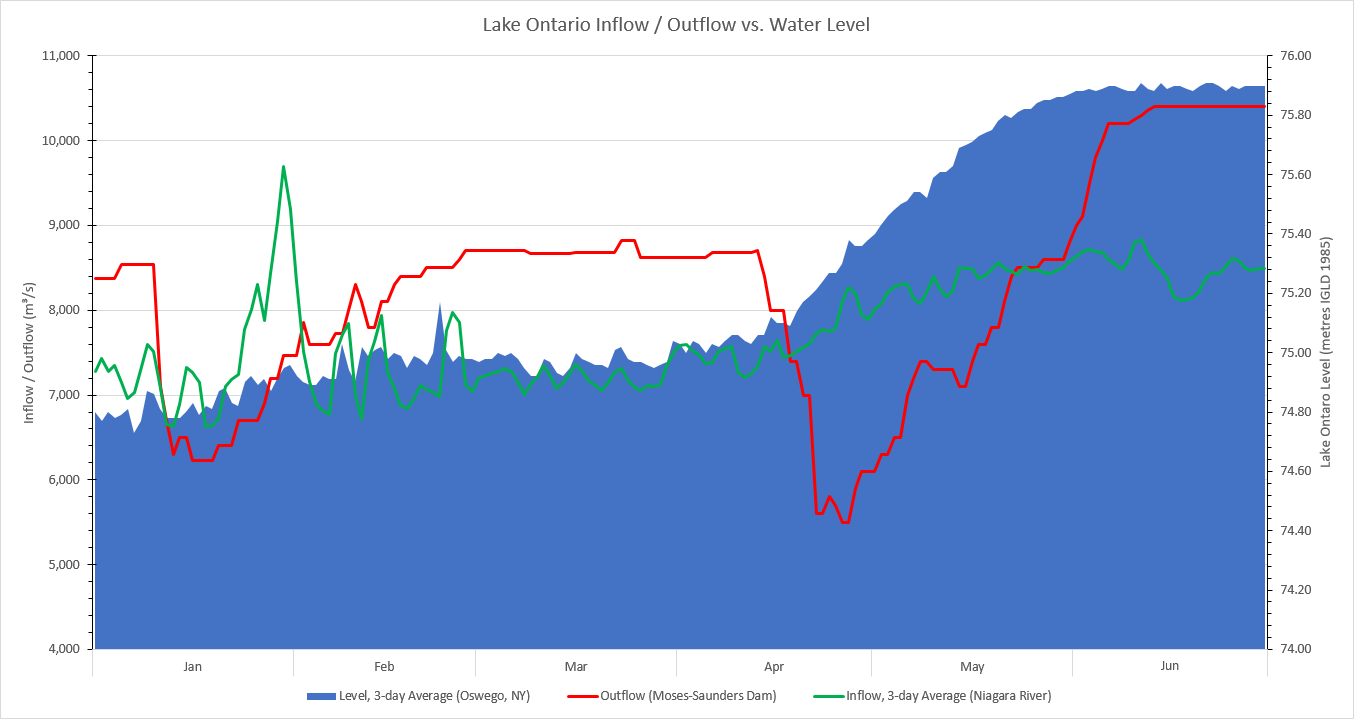
Between April 18 and May 21, 2019, there was an average of 114.85 million m³ more water flowing into Lake Ontario than flowing out each day. Over 34 days, that makes for a total of 3.9 billion m³ of water. If you didn’t account for elevation, that would be enough to cover the city of Toronto in 6.2 metres of water (Note 4). Accounting for elevation however, that’s enough water to flood downtown Toronto, East York and south Etobicoke (up to the old Iroquois shoreline) with as much as 50 metres of water (Note 5).

So, a lot of water. Spread out over the entirety of Lake Ontario however, it rose 70 cm, which is enough to impact the entirety of Toronto’s 111 km of shoreline, and thousands more kilometres of shoreline across the rest of the lake (Note 6).
So what are the odds of this happening again? I can’t tell you exactly. I have delivered simplified numbers here, and don’t have a good enough understanding of inter-year and inter-seasonal effects on basin supply and drain.
But based on my knowledge of climate change phenomena, I think the chances are good. Climate change is forecasted to increased precipitation for the Great Lakes Basin, and this may have an impact, particularly if increasingly severe storms means more rainfall runs off into local watercourses instead of being absorbed by the ground and transpired by plants. Furthermore, there is increasing evidence to suggest climate change may increase the frequency and severity of polar vortexes, which could extend winters and delay spring vegetation growth.
So perhaps it’s time to talk about how we manage the inflows and outflows of the Great Lakes. Should we be taking steps to regulate flows out of Lakes Michigan, Huron and Erie? Should we begin to deregulate flows out of Lake Ontario and find another way to mitigate flooding in the St Lawrence?
That discussion would be a geographical (upstream and downstream) and impact-based (net natural, social and economic) balancing act. And that’s way beyond a single blog post or a single year of records.
Notes
1. Lake height measurements are from the National Oceanic and Atmospheric Administration’s master gauges (Superior – Marquette C.G., Michigan – 9099018 | Michigan-Huron – Harbor Beach, MI – 9075014 | Erie – Fairport, OH – 9063053 | Ontario – Oswego, NY – 9052030) and are based on the International Great Lakes Datum, 1985. Monthly/annual maximums, averages and minimums available here.
2. Neff and Nicholas (2005). Uncertainty in the Great Lakes Water Balance: U.S. Geological Survey Scientific Investigations Report 2004-5100, Table 6. Data is from 2003, and a contact at the University of Michigan indicated that it is out of date. A more up-to-date water balance model is available, but I did not have enough time to crunch the data. That said, these figures should provide a good sense of magnitude of importance.
3. Flow rates on the Niagara River and Welland Canal are obtained from Hydrometric Data provided by Environment Canada’s Water Office.
4. Not accounting for elevation, Toronto has an area of 630.2 km² (per StatsCan); taking the volume (of water in lake Ontario) and dividing it by area (of Toronto) equals height (3.9 million km³ / 630.2 km² = 6.2 m).
5. I obtained a simplified line drawing of the shore from BlogTO, eliminated the segment east of Scarborough Heights Park, and converted into a polygon (area is 152 km²). I then employed simplified math to illustrate how much water there is; assuming that this area was a triangular prism, with a height equal to point where the slope starts a significant elevation increases (~130 m above sea level, near Yonge Street and Woodlawn Ave; difference from the lowest point in Toronto of 76.5 metres of 53.5 metres from the shore). The volume of this perfect triangular prism is therefore area * height divided by 2 (152 km² * 53.5 m = 4,066 km³). To reverse-calculate how high the water would be for a different volume of water (e.g. the net flow into Lake Ontario; 3.9 million km³), you can multiply the volume by 2, and divide by the area ([3.9 million km³ * 2] / 152 km² = 51.4 m).
6. Toronto’s shoreline length is calculated based on my previous #shorelineTO work. Lake Ontario’s shoreline length is quoted as 1,020 km, however, this measurement may be subject to the coastline paradox to a greater degree than my measurements in Toronto.

One thought on “The Ins and Outs of Lake Ontario”